Render capacity on the web: an honest estimate, one line, quotas, render workers
The third product audit (docs/audits/product-audit-2026-10d.md, finding 9; the 0.11 plan's
item 4) found every web render drawn in software on one small machine. The service is one Fly
performance-2x Machine (2 vCPUs, 4 GB, tools/host/fly.toml) rendering on Mesa's lavapipe:
every person's previews and renders shared its two CPUs, at once, and nobody was told how long
theirs would take. A 52-second preview took over 7 minutes on the dev box.
This is what was built, in order:
- An honest estimate of a render's time from its frames, its quality and the machine, built from renders measured at the service's size and checked against others (below, "Measured").
- One line for the service's CPUs, and the estimate shown when a web person asks for a preview or a render: "about 7 min here, after 1 ahead of you", with their own computer beside it (its time when one is paired, else how to pair one).
- Render minutes a day and a month per account in the admin console, with what a minute costs the service, enforced where a render starts.
- Render workers: extra Fly Machines, started through the Machines API when a render can use them and stopped when idle, that draw a render's chunks. Off (0) until the owners turn them on.
- Drawing on the person's own GPU, measured, not built: how close web Studio's player is to the render, what browsers can encode, what a frame costs on a laptop, and a recommendation for a browser runner for previews as the next branch.
1. The estimate
The service's estimate comes from its own finished renders. What was measured on the dev box (below) is only where it starts: the prior, said with a wide range until the service has drawn enough of its own.
The service's own renders (RateBook, core/src/render/estimate.ts)
Each render the service draws alone (not spread over workers) is kept in
<data>/render-rates.json, by quality: its frames, the seconds it took to draw and encode (its
render.json timings, its waits for turns left out), what the prior said for it, and when. The
next render at that quality is timed by those:
- Its seconds a frame are the service's own. Each kept render's ratio to the prior is how much slower or faster the service drew than the dev box said; the estimate is the prior's for the render asked about times their mean (geometric). A render of another size is scaled by the prior's shape (a frame's cost grows with its megapixels) but timed by the service's speed.
- Recent renders weigh most. The newest counts 1, each older one 0.8 of the one after it, and 30 are kept a quality: a render 10 back counts a ninth as much as the newest. A deploy, a new Machine, or Godot or Mesa changing their speed shows within a few renders.
- A range, once there are enough. With five or more, the range is how much the service's own renders vary: 1.28 standard deviations of their ratios either side (about 8 renders in 10 inside it), never less than a tenth either side. Studio says it as people read a range: "about 6–8 min here, after 1 ahead of you".
- Before that, the prior's wider range: 0.7 to 1.8 times its estimate (
PRIOR_RANGE; why those, under "The prior's range"), around the service's own ratio once it has one. The demo's cold open, before the service has drawn anything: "about 15–38 min here, starting now". - One odd render cannot make every estimate absurd: a ratio is held between 0.25 and 8.
The line's places (section 2) use the same rate, and the range covers the waits too: a render
ahead is drawn on the same CPUs. The host's log says what each render taught it: "renders:
s against s measured; preview now s a frame here,
Measuring it on Fly (tools/host/rate-check.ts): after a deploy the lead runs it with a test
account's cookie against the live service. It makes the account a copy of the demo, reads the
estimate Studio would show for the cold open's preview, starts that render on the service, times
it from asking to done, and prints the estimate before, the real time (its waits, drawing and
encoding apart, from its render.json), how far off the estimate was and whether inside its
range, and the estimate after, now from the service's own render. Its JSON (--out) is the
record for this doc.
The prior: the rates measured here
estimateRender(size, machine), in CPU-seconds, the work itself, turned into time as the lead
asked: service time = CPU-seconds a frame × frames ÷ (CPUs × efficiency), the efficiency
measured with the CPUs to the render alone:
seconds = 38                                                   fixed
        + frames × (1.738 + 1.888 × megapixels)                CPU-seconds to draw and check a frame
          ÷ (CPUs × 0.96, or × 0.78 with several chunks at once)
        + frames × megapixels × (0.0404 preview | 0.449 full)   CPU-seconds to encode a frame
          ÷ (min(CPUs, 8) × the same share)
- Fixed, 38 s on two CPUs: the tools and the engine checked and the episode compiled before the first frame, and the sound mixed after the last (32 to 43 s alone).
- Drawing: 3.478 CPU-seconds a 1280x720 frame and 5.653 a 1920x1080 one (p240b, f240b below). Lavapipe draws a frame on every CPU it is given, and a render worker draws several chunks at once, so a machine does the work at its CPUs times the share of them a render keeps busy.
- The share: 0.96 (0.956 and 0.965 measured drawing alone on two CPUs); 0.78 for several chunks at once on one machine (0.76 and 0.81 on eight CPUs in four chunks), as the chunks end one by one and the last draws alone.
- Encoding in the render's profile (
render/encode.ts): a preview's light proxy is a small part; a master is 0.93 CPU-seconds a 1080p frame. ffmpeg's eight threads cap it. - A real GPU (a runner's): 0.198 s a megapixel per Godot job, from the M15 measurement (the
cold open's 674 frames drawn in 20.5 s in six jobs on an RX 6700 XT). A runner whose renders
the service has timed (
RunnerMeasures.drawMs) is estimated by its own speed instead.
The demo's cold open (674 frames) on the service's two CPUs, as the prior says it: a preview about 21 min (1272 s; "about 15–38 min" with the prior's range), a full render about 39 min (2349 s).
Measured
tools/host/render-rate.ts renders an episode as the service's daemon does (batches of about a
minute, checked first, STUDIO_BATCHES), times each stage by the clock and by the CPU time of
every process it ran, and writes rate.json. Each ran in its own heavy slot, pinned with
taskset -c (REELWRIGHT_RENDERER=lavapipe, LP_NUM_THREADS 2), on the dev box (AMD Ryzen 9
5900X, 12 cores, 24 threads) on 2026-10-12 and 13.
The clock on this box measures other people's work too. The load was 40 to 77 on 24 threads
in every run, and others took 17% to 52% of the very CPUs a render was pinned to. So the rate
tool also works out how long each render would have taken with its CPUs to itself: every 100 ms
it reads each of its threads' running and waiting time (/proc/<pid>/task/<tid>/schedstat); a
stretch in which r of its threads wanted a CPU would have run on min(r, CPUs) of them, and the
time they waited for one, others had (aloneSec, each stage's too, and efficiency, its CPU
time over CPUs × that). Checked on busy loops pinned to two CPUs: one loop keeps 0.51 of them
busy, two 0.99, three 0.99. The later four runs were measured so, pinned to whole cores (2 and
14 are one core's two threads, as the service's two vCPUs may be; 4-7 and 16-19 four cores').
They are core/test/fixtures/render-rate/measured.json; the rates come from p240b and f240b, and
core/test/render-estimate.test.ts holds the estimate to every alone-timed run within 30%, and
below every run that shared its CPUs:
| Run | Quality | Frames | CPUs | Draw, CPU-s a frame | Clock | Alone | Estimated | Off alone | Others' share | Load |
|---|---|---|---|---|---|---|---|---|---|---|
| p240b | preview 1280x720 | 0:240 | 2 (one core) | 3.48 | 649 s | 484 s | 477 s | −1.4% | 0.30 | 42–45 |
| f240b | full 1920x1080 | 0:240 | 2 (one core) | 5.65 | 994 s | 846 s | 861 s | +1.7% | 0.18 | 45–49 |
| w8pb | preview 1280x720 | 0:674 | 8, 4 chunks | 3.65 | 683 s | 432 s | 418 s | −3.3% | 0.52 | 67–40 |
| w8f240b | full 1920x1080 | 0:240 | 8, 4 chunks | 5.59 | 387 s | 260 s | 291 s | +11.9% | 0.46 | 47–67 |
| p240 | preview | 0:240 | 2 | 3.60 | 679 s | – | 477 s | (clock −29.7%) | 0.30 | 41–74 |
| pall | preview | 0:674 | 2 | 3.86 | 1752 s | – | 1272 s | (clock −27.4%) | 0.22 | 42–54 |
| f240 | full | 0:240 | 2 | 5.89 | 1062 s | – | 861 s | (clock −18.9%) | 0.20 | 44–64 |
| f480 | full | 240:480 | 2 | 7.66 | 1282 s | – | 861 s | (clock −32.8%) | 0.17 | 42–45 |
| w8p | preview | 0:674 | 8, 4 chunks | 3.56 | 615 s | – | 418 s | (clock −32.1%) | 0.47 | 43–77 |
| w8f240 | full | 0:240 | 8, 4 chunks | 5.46 | 347 s | – | 291 s | (clock −16.0%) | 0.41 | 74–72 |
The first six of 2026-10-12 measured only the clock and the CPU time; they are kept as checks of the CPU work a frame and as what a shared machine does to the clock.
- Against runs that were not contended. None on this box was: others had at least 17% of the
pinned CPUs in every run, so the alone times above are worked out from the threads' running and
waiting, not read off a clock. The least contended run measured by the clock is M15's, of
2026-10-06 (
m15-runners.md, "Measured"): the whole preview on two pinned CPUs at a load of 13 to 23, in 1001.7 s; the prior says 1272 s, +27%. That run's two CPUs were on two cores whose other threads were idle, so each drew at a whole core's speed (about 2.55 CPU-seconds a frame, its draw time × 2 × 0.96, against 3.48 on one core's two threads); this is the low end of the prior's range. - What drawing on eight CPUs gains, by CPU time. A 1080p frame took 5.59 CPU-seconds drawn in four chunks on eight CPUs and 5.65 on two: the same work, so eight CPUs do four times as much a second at the same share. They keep 0.78 of themselves busy rather than 0.96 (the chunks end one by one), so a render worker of eight CPUs draws 4 × 0.78 ÷ 0.96 = 3.25 times as fast as the service's two; f240b and w8f240b alone, 846 s against 260 s, say the same.
- Episodes differ. The whole preview costs 3.65 to 3.86 CPU-seconds a frame against 3.48 for its first 240, and the full render's frames 240 to 480 cost 7.66, 35% more than its first 240 (5.65): the shots differ. The prior knows sizes, not shots; the service's own renders correct the level, not the episode.
Measured on the service's own machine (2026-10-14)
A new show's preview on the live service's Fly performance-2x (2 vCPUs, AMD EPYC, lavapipe),
nothing else drawing there (others had 1.4% of its CPUs): Kitchen Science, the fourth product
audit's show made from its words at 0.11.0, voiced, 1,147 frames at 1280x720, its show copied
to the machine's /tmp and drawn by the deployed 0.11.1 (322f2e653).
| How | Batches | Drawing | Encoding | Whole | The estimate | Off |
|---|---|---|---|---|---|---|
As the service draws it: render-rate.ts, batches of about a minute (flyks in measured.json) |
33 | 2160.0 s | 17.9 s | 2213.9 s (2149.5 alone) | 2138 s (1497 to 3848) | −3.4% (−0.5% alone) |
One engine job: reelwright render --preview |
1 | 1852.2 s | 17.9 s | 1875.7 s | 2138 s | +14% |
- The prior holds on Fly. The service's estimate before it has drawn anything says 2138 s, "about 25 min–1 h 5 min"; the render took 37 minutes as the service draws it. Within its range and 3.4% under, so the rates stand as they are.
- Batches cost about 9 s each. Every batch starts Godot again and builds the set: 2160 s in 33 batches against 1852 s in one job, 9.3 s a batch, 14% of the drawing (a one-frame job takes 25 s there, the engine checked and the episode compiled too). The prior already holds it: its rates were measured in batches. A batch is sized by time (about a minute at the speed so far), so the restarts are the same share of every frame, however long the episode: a rate a frame that counts them is right at any length.
- A 21-minute episode (30,240 frames at 24 a second): the prior says 55,400 s, 15.4 hours ("about 10 h 45 min–27 h 40 min"); at Fly's measured 1.899 s a frame, batches and encoding in, 57,450 s, 16.0 hours: 3.7% more.
- A frame's work on Fly is about the dev box's: 3.41 CPU-seconds a frame for this new show, restarts in, against the prior's 3.48 for the cold open; a new show's shots cost about what the cold open's do.
Where a preview's minutes went (2026-10-15)
The cold open's preview as the service draws it (render-rate.ts, one engine across the
batches, one core's two threads, lavapipe), measured by stage, by thread and by pass:
- Drawing is all of it. 1,256 s alone: checking 47 s, drawing 1,190 s, mixing and encoding 18 s. Of the CPU time, lavapipe's raster threads took 75%, Godot's main thread 10.5%, the PNG writers 9.6%. No frame of the 674 is the one before it, so holding frames saves nothing.
- Reading the frame back is the wait for lavapipe, not the copy: a second read of the same frame takes 3.9 ms. Godot's GPU profile puts 87% of lavapipe's time in Render CanvasItems, the 2D drawing; the 3D passes, shadows (0.3%) and MSAA in 3D are small.
- The 2D was characters drawn where nothing showed them. In the close-ups (frames 151 to
449, 3.22 s a frame against about 1.5 elsewhere) Culpepper stands beside the camera while it
is on Otto, and his card was drawn whole at up to 12.2 Mpx a frame, 13 frames' worth of
pixels. A render's card now draws only the part of the body its camera can show
(
RwCharacterCard.clip_to_view, its rect clipped to the camera's frustum); unseen, a card keeps 16x16 pixels.
| The cold open's preview, two CPUs | Before | After |
|---|---|---|
| Whole, alone on the CPUs | 1,184 s | 715 s |
| Drawing | 1,122 s | 658 s |
| CPU | 2,328 s | 1,401 s |
| Close-ups (frames 151 to 449) | 3.22 s a frame | 1.29 s a frame |
The before on 0.12.1's head, the after on batch 16 with the clip (13d893a89); in every frame
at most 13 pixels differ by more than 2 levels, by rounding at drawn edges. The prior's rates were measured before the clip: for a show with
close-ups they now say more than the render takes, which the service's own renders correct
(RateBook) after five.
Measured and not taken: 2D MSAA off (−17% CPU on the close-ups before the clip, about 200 edge pixels a frame), 540p (−27%, visibly softer), 3D MSAA off (−9%, aliased edges), a 2048 shadow map (−4%), softer shadow filtering (0).
The prior's range
Until the service has drawn five renders of a quality, the prior is said as 0.7 to 1.8 times
itself (PRIOR_RANGE):
- 0.7: the quietest render measured, on two CPUs on cores of their own (above), drew in 0.73 of the time the prior says.
- 1.8: on this box, renders took up to 1.58 times their alone time while others shared their CPUs (w8pb), and Fly's CPUs are not the dev box's.
- On a real service:
tools/host/rate-check.tsagainst this box's own service on four CPUs (8, 9, 20, 21) under a load of 30 to 50 took 1052 s for the cold open's preview; the earlier prior said 862 s (535 to 1271 s), this one 655 s (470 to 1149 s). Both ranges hold it; this box's clock is not Fly's.
2. One line, and the estimate when someone asks
The line (core/src/host/render-line.ts)
Each show's daemon used to draw its renders at once with every other show's, so two people's
previews shared two CPUs and each took twice as long, unpredictably. A line of whole renders
would be worse: one person's 22-minute episode would hold up everyone's 10-second preview. So the
service's CPUs go a turn at a time, and a turn is one engine job: a batch of about a minute
(render/batches.ts), or with render workers the service's own chunk. When the CPUs are free,
the next turn goes to:
- a preview before a final render;
- then the account whose last turn was longest ago (one that has had none, first), so accounts take turns;
- then, within an account, the render that joined the line first.
How it runs:
- A render on the service joins the line once its episode has compiled and its frames are known:
the pipeline's
turn(render/pipeline.ts), which the daemon answers by asking the servicerender.plan(studio/service-turns.ts, oversession/service-link.ts), answered at once with any render workers it may use. The account it is drawn for is whoever asked for it (RenderWatch.userOf). - Each of its engine jobs then asks
render.turn(TakesTurns, wrapped round the engine) with the frames it is about to draw and those it still draws here, and runs when the line gives it the CPUs. Its last turn ends as it asks for the next, or as it ends. - A render waiting longer than a quarter of a second says so: stage
queued(before its first turn it says nothing of drawing). The waits are no part of its timings (render.jsontimings.waitMssays them apart) and no render minute:jobs.tsRenderWatchcounts a render's minutes only while it is notqueued. - A render that stops while it waits (cancelled, paused, its daemon gone) leaves the line; one that ends gives the turn to the next.
- Everyone in a waiting render's show is told its place:
render.eventwithstage: "queued",ahead(renders that draw before its next turn) andestimateSec(about how long from now until it is drawn, its waits included), sent again whenever the line moves, and put in the daemon's own queued event as it passes through the host's pipe (service-renders.tstailor). Session protocol 1.7. Studio's render queue, the episode's card and the dashboard say "Waiting its turn on Reelwright: 1 ahead · about 7 min left" (RwRenderQueue.turn_words). - Both numbers come from playing the line forward in its own order, turn by turn, every render
in it asking again as each turn ends, until the render asked about has had all it needs. The
render drawing now has what is left of its turn (its own
etaSecbounds it, once it has a speed; never under 10 s); every other has its estimate, refreshed at each of its turns. - So Ada's full render of a long episode and Bo's preview asked for while it draws: Bo is told
"after 1 ahead of you" and about Ada's current batch plus his own time; his preview draws as her
batch ends, every turn of it, and hers goes on after (
core/test/host-render-line.test.ts). Finals wait while previews keep coming: previews are short.
What someone is told as they ask (core/src/host/service-renders.ts)
GET <base>/api/renders/estimate?show=<key>&episode=<id>&quality=preview|full&frames=<n> (signed
in; a show the person is not in is a 404):
{"estimate": {"frames": 674, "width": 1280, "height": 720, "quality": "preview",
  "here": {"seconds": 2100, "waitSec": 420, "ahead": 1,
           "text": "about 35 min here, after 1 ahead of you"},
  "runner": {"id": "rn_…", "name": "Wil's box", "online": true, "seconds": 70,
             "text": "about 1 min on Wil's box"},
  "runners": {"enabled": true, "paired": 1, "route": "mine"}}}
here: the service's estimate (corrected), the line played forward with this render in it as it would join (after the renders already waiting in this show's own queue): how many draw before its first turn, and the time until it is drawn, the check and compile added.runner: the runner the render would go to (the least busy online that takes renders, the one that draws the most at once among those; else the newest paired,online: false, "Wil's box is offline"), estimated by its machine (cores, a real GPU or not, the Godot jobs it draws in) or by its measured speed. None for a shared show whose owner keeps its work on Reelwright, or while the owners have runners off (enabled: false).- The picture's size is the show's own (
show.jsonformat), a preview's at its preview height.
In the web Studio (engine/addons/reelwright/ui/rw_render_where.gd RwRenderWhere): Render
preview and Render, on an episode's card, the dashboard and the review player, first ask where
(where_asker, set by RwStudio.ask_where on the web only; the desktop renders as before):
- Here on Reelwright, "About 26 min–1 h 5 min here, after 1 ahead of you.", the chosen place drawn as chosen (a filled disk in the accent).
- The words are Studio's, made from the estimate's numbers (its range, how many are ahead, the
computer's seconds) through RwLang, so they follow the person's language: "Entre 14 y 25 min
aquí, con 1 render por delante." in Spanish. The service's
textsays the same in English for other clients. - On Wil's box, "About 1 min on Wil's box.", picked when the person's choice for the show is their computer; greyed, "Wil's box is offline.", when it is not on.
- With no computer paired: "Your own computer can render this, often much faster, and uses none
of your render minutes here." and Add a computer…, which opens Your computers, whose Add a
computer makes the pairing code and the command (
m15-runners.md). - Start renders it where picked (
renders.startwithon: "service"or"runner"); Cancel or closing it renders nothing. Without the episode's frames (it does not compile) it renders as before, unasked.
3. Render minutes a day and a month
settings.ts Quotas.renderMinutesPerDay beside renderMinutesPerMonth (default none; the free
tier's, 20 a day and 60 a month), each the service's default, the free tier's over it, and an
account's own on its page (user_quotas). A render minute is a minute of the service's machine
at work on a render, from its first stage to its end, its wait for its turn left out; the minutes
count in the day (render_day_usage) and the month (render_usage) the render ended.
Enforced at the service's boundary: the host's pipe answers a renders.start itself, before
the daemon hears it, once the day's or the month's minutes are used (jobs.ts refusal):
You have used your 20 render minutes for today on this Reelwright service. They start again at midnight UTC, in about 5 hours. Meanwhile your own computer can render it, which uses none of them: Your computers, in the show menu.
(quota.render_minutes_today; the month's says when it starts again, quota.render_minutes.) A
render on the person's own computer costs none; a render under way finishes. GET /api/usage
and Studio's Settings › Account list "Render minutes today" beside the month's.
What a minute costs the service, in the console's Settings › Quotas (costs.ts): at Fly's list
price, read on 2026-10-12 from https://docs.fly.io/about/pricing:
Machines are billed by the second while they're running … Started Machine,
performance-2xwith 4GB RAM | $66.00/month
(the page's own rate, PRICE_PER_VCPU_SECOND performance 0.000012732, a vCPU with its 2 GB, a
second; "Monthly Machine prices assume 30 days of continuous runtime"; Ashburn, iad). So a
render minute is $0.0015 of the machine; 20 a day at most $0.03 an account, 60 a month $0.09.
The machine runs whether it renders or not: a minute is what one person's render takes from
everyone else's. Each limit says its cost beside it, the quotas section what everyone rendered
this month and its cost, and a person's page their minutes this month with theirs.
core/test/render-workers.test.ts holds the service's size in costs.ts to fly.toml's.
4. Render workers
GPUs on Fly, as of 2026-10-12: no
Fly's documentation no longer has GPU Machines. Every page under https://docs.fly.io/gpus
(/gpus, /gpus/getting-started-gpus, /gpus/gpu-quickstart) answers 308, to the blog post
"We Were Wrong About GPUs" (https://fly.io/blog/wrong-about-gpu/, 2025-02-14: "If you're using
Fly GPU Machines, don't freak out; we're not getting rid of them. But if you're waiting for us to
do something bigger with them, a v2 of the product, you'll probably be waiting awhile."); the
docs' index (https://docs.fly.io/llms.txt) lists no GPU page; https://fly.io/gpus is a 404; and
Fly's customers were told GPUs "will be fully deprecated as of July 31, 2026" (quoted from Fly's
email in https://community.fly.io/t/gpu-migration-fly-io-gpus-will-be-deprecated-as-of-july-31-2026/27110).
The Machines API reference still lists gpu_kind, with no kinds documented. And Godot needs
Vulkan with a display, which Fly's CUDA Machines were never set up for. So the workers are larger
CPU Machines drawing lavapipe chunks in parallel.
How they work (core/src/host/workers.ts, core/src/runner/worker.ts)
- The setting (console Settings › Render workers,
settings.tsworkers): at mostmaxat once (0 to 8; 0, the default, is none, and nothing here runs), each ofsize(performance-4x,-8xor-16x), stopped afteridleMinutes(1 to 60, default 5) with nothing to draw. Turned down, the idle ones stop at once. - Fly's API: only with
FLY_API_TOKEN(a secret,fly tokens deploy) and Fly's ownFLY_APP_NAME,FLY_IMAGE_REFandFLY_REGION; read once and gone from the service's environment (cli/host.ts). The calls are the Machines API's (https://docs.fly.io/machines/api/machines-resource): list bymetadata.role=reelwright-worker, create withskip_launch(the service's own image,guestperformance with 2 GB a CPU,init.execreelwright worker --service <address>,restart: no), start, stop, and destroy a stopped one made from an image the service no longer runs (deployed since). Nothing else is ever asked of Fly.core/src/host/fly-machines.ts. - A render's turn (
plan): with workers on and a render whose deliverables are not made from every frame, its frames are drawn in chunks, one by the service andsharea worker (a part on every two of its CPUs: 4 on aperformance-8x), each at least 48 frames, at most 32 chunks. The workers it needs are started then, so they boot while the service draws its own chunk. - A part (
render.part, only for the render drawing now): the chunk's engine job folder,<show>/.reelwright/jobs/<id>/job.jsonand the files it names (partManifest), each with its SHA-256. The worker with the most room takes it; it fetches each file (GET <base>/worker/parts/<part>/<path>), checks its bytes, draws, checks every frame, encodes the chunk's segment in the render's profile (drawPart), and sends back the segment and the engine's result (PUT …/out/segment.ts,…/out/result.json, each with its SHA-256, checked as it lands), thendone. The daemon puts them in the chunk's folder (placePart) and checks them as its own (verifyEncoded), then joins the segments (render/encode.ts). - A worker lost mid-chunk (its socket drops, or it draws nothing new for five minutes, or it
fails) gives its part to another worker, once; else back to the service, which draws it
(
FarmEngine's "came back undone"). When no worker is left and none is starting, every part waiting goes back at once. A worker's part still away 120 s past the service's own pace is drawn by the service too, the first to finish kept (WORKER_LATE_MS). A worker that never connects within four minutes is stopped. - Its identity: a token of its own (
rww_, 32 random bytes) made with its Machine, in its environment, kept as its SHA-256 (render_workers). It opens the worker's socket and the files of the parts it holds, nothing else: not another worker's part, not a path its part does not name, never a link out of the job's folder. - What they ran: each Machine's minutes from start to stop, by month (
worker_usage); the console says how many run now and what they cost this month.
What they cost, and what they save
At Fly's list prices (above; costs.ts):
| Worker | CPUs, RAM | An hour while it runs | Stopped (its disk) |
|---|---|---|---|
performance-4x |
4, 8 GB | $0.18 | $0.15 a GB a month |
performance-8x (default size) |
8, 16 GB | $0.37 | $0.15 a GB a month |
performance-16x |
16, 32 GB | $0.73 | $0.15 a GB a month |
The expected speed-up comes from the measurements, by CPU time (above): a worker's eight CPUs draw a frame for the same CPU-seconds as the service's two, at a share of 0.78 against 0.96 as its four chunks end one by one, so 3.25 times as fast as the service. For the demo's cold open (674 frames), as the prior says it:
| Service alone | With 1 × performance-8x |
With 2 × performance-8x |
|
|---|---|---|---|
| Chunks (service + workers) | batches | 5 (1 + 4) | 9 (1 + 8) |
| Preview (1280x720) | ~21 min (1272 s) | ~7 min: 135 frames a chunk; the service's in 245 s, the worker's four in 301 s behind a minute for it to start | ~4.5 min: 75 frames a chunk, the workers' in 167 s after their start |
| Full (1920x1080) | ~39 min (2349 s) | ~11 min: the worker's chunks in 489 s and 81 s to encode their segments, after its start | ~7 min |
| Worker time a render (running, then the 5 idle minutes) | – | ~6 + 5 = 11 min: $0.07 (preview); ~10.5 + 5 = 15.5 min: $0.09 (full) | 2 × (~4 + 5) = 18 min: $0.11 (preview) |
So one performance-8x makes a preview about three times faster for about seven cents; renders
back to back share the idle minutes, and a worker left idle costs $0.37 an hour until it stops.
Lower idleMinutes to 1 for the least waste. A whole 22-minute episode at full size (31,680
frames) is about 30 hours on the service alone; with two performance-16x (8 chunks each, 17 in
all) about 2.2 hours, at about $3.40 of worker time.
The lead turns them on, after the owner agrees to the cost: set FLY_API_TOKEN (fly secrets set), then Settings › Render workers to 1. Nothing in this change creates, starts or scales a
Machine, sets a secret, or deploys.
5. Drawing on the person's own GPU
The estimate is honest, and the number it gives is the problem: the cold open's 28-second preview
took 1052 s on four of this box's CPUs (tools/host/rate-check.ts, nothing ahead of it), and
render workers only divide that by how many there are, at a price. Most people who open web
Studio have a GPU, and web Studio already plays an episode on it, in WebGL 2. Could the browser
draw the preview, and encode it, itself?
5.1 The player's picture against the render's
The service renders with Godot's Forward+ renderer (Vulkan, on lavapipe); the web export runs
its Compatibility renderer (WebGL 2), as engine/project.godot says
(rendering_method.web="gl_compatibility"). Drawn both ways, eight frames of the cold open
(24, 100, 200, 300, 400, 500, 600, 660), at the size the page's player drew them:
- In the page:
tools/web/player-frames-check.tsopens the cold open on web Studio's timeline in Chromium (WebGL 2 on SwiftShader, which is right for the picture, not its speed), types each frame into the timecode and reads the picture off the engine's canvas once it holds still: 963x541. - As renders:
reelwright stillsof the same frames at 962x540, once with Forward+ on lavapipe (the service's) and once with Compatibility on llvmpipe (opengl3, the web export's renderer on the desktop, which separates the renderer from the browser). tools/web/player-frames-compare.pysets them side by side (pf/pf2, 2026-10-13).
In plain numbers, where a "visible" difference is more than 16 of 255 levels in a channel:
| Mean difference a channel | Pixels visibly different | PSNR | |
|---|---|---|---|
| Render against the web player | 4.4 to 6.1 levels | 3.5% to 20.5% | 27.8 to 31.1 dB |
| Render against Compatibility on the desktop | 1.1 to 3.4 levels | 1.9% to 23.4% | 30.8 to 36.5 dB |
| Compatibility on the desktop against the web player | 3.9 to 4.7 levels | 1.2% to 4.0% | 29.3 to 32.7 dB |
The worst frame, 500 (the Chief behind his smoke at the console), with the differences four times as bright:
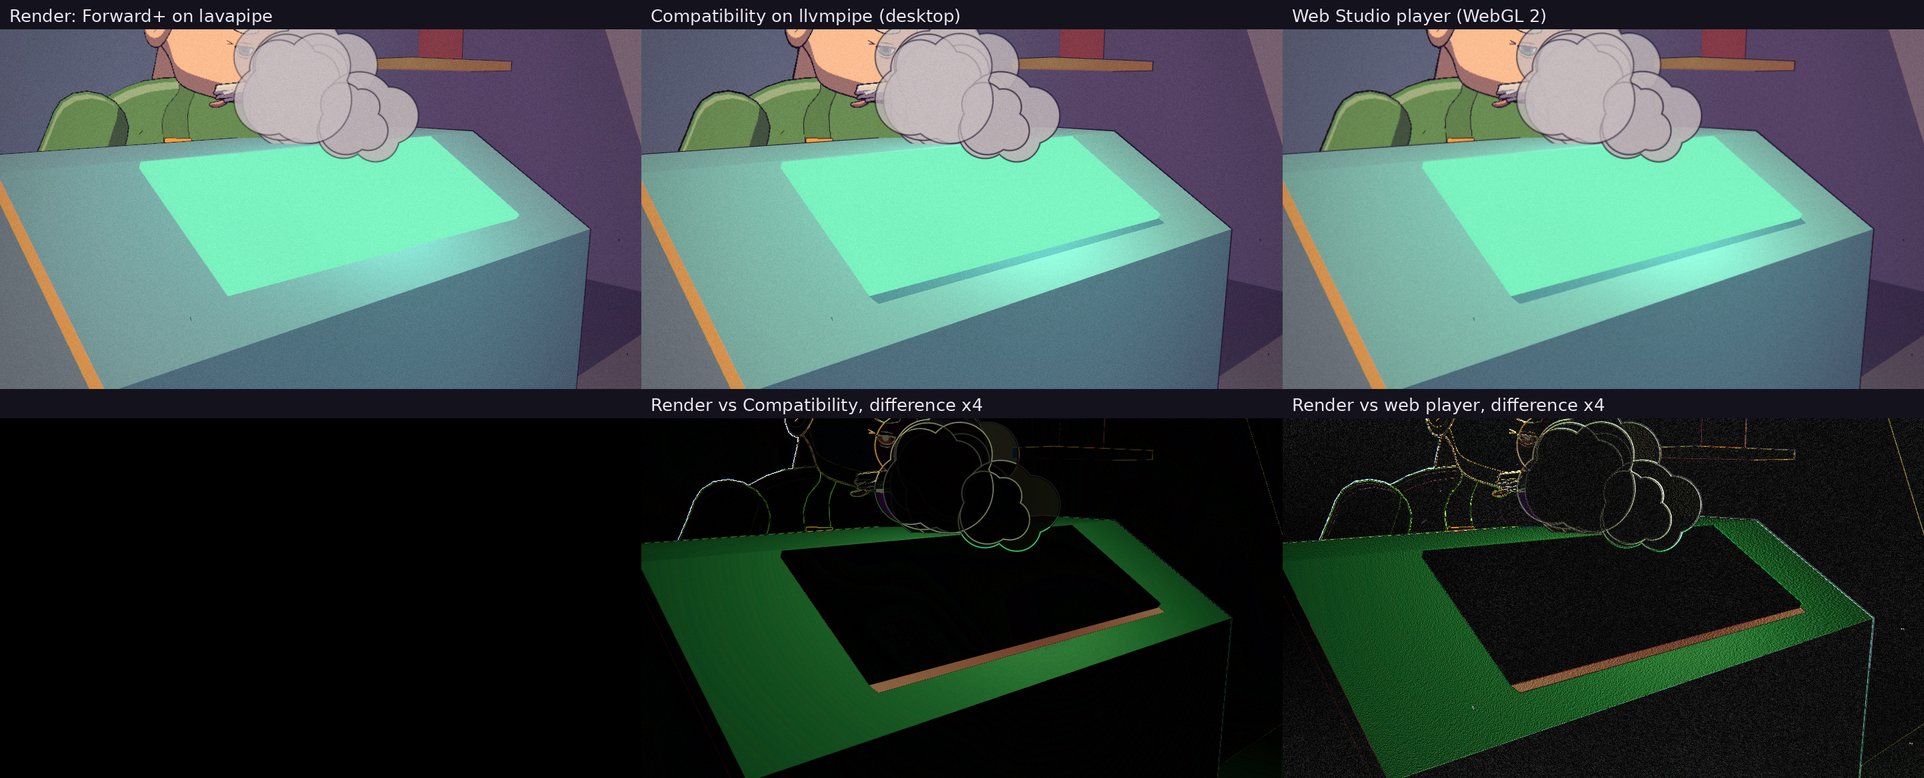
Every difference found, by what the lead asked about:
- Lighting: the one real difference, and it is the renderer's, not the browser's. Surfaces lit by a coloured light come out greener under Compatibility: the console's top under its cyan screen, 12 to 14 levels more green (frames 400 and 500), and the porthole's yellow rim 12 (frame 300); red and blue within 2 to 5. The screen's front edge shows as a lit strip under it in Compatibility and not in Forward+. Desktop Compatibility and the web player agree on these surfaces to 0.3 levels: the browser draws what Compatibility draws.
- The grade and the post layers carry over. Each picture's mean brightness is 0.5 to 2.7 levels above the render's in both Compatibility pictures (the most where the console's light is), its saturation within −1.6 to +2.9 of 255; the grade's look, the vignette and the paper are there in all three.
- Grain. On a flat wall the two stills match to 0.25 levels, paper and grain included (both seed it by the frame); the page's grain is a different pattern there, about 4 levels from either and a little weaker (a spread of 4.4 levels against 5.4). The grain is drawn in screen pixels and the page's picture was a pixel wider and taller than the stills, so some of this is the size; a browser runner draws at the render's own size and would show whether any is left. It is what makes the mean difference against the web player 4 to 6 levels while the pixels visibly different stay few.
- Outlines. The characters' and the set's ink lines land up to a pixel apart between the renderers (the rings in the differences); between desktop Compatibility and the page, the same.
- Mouths. The same mouth shape in all three at every frame compared (Otto's smile and open-mouthed words at 100 and 300, the Chief's at 400 and 500): the lip sync is the episode's, not the renderer's. Only their outlines differ, as above.
- Nothing missing. No layer, character, prop or set piece is absent from any of the 24 pictures, and the page's console said no errors.
So the picture does not match the render exactly, and the difference is Compatibility's lighting of coloured lights, plus grain and a pixel of outline. It can be made to match, from either side: the lighting difference is one renderer feature to find and even out (the engine's lights authored to look alike in both, or Compatibility's light falloff matched); or the service draws its previews with Compatibility too (on llvmpipe, which also costs 0.63 of the CPU work, 5.3), so that a preview looks the same wherever it was drawn, and final renders stay Forward+.
5.2 Encoding in the browser: WebCodecs
The browser would draw each frame at its own pace (not in real time), hand it to a
VideoEncoder as a VideoFrame, encode the mixed sound with an AudioEncoder, and put both in
an MP4 (in script: browsers have no MP4 writer of their own).
MDN, read 2026-10-12: "The VideoEncoder interface of the WebCodecs API encodes VideoFrame objects into EncodedVideoChunks", marked "Limited availability: This feature is not Baseline because it does not work in some of the most widely-used browsers", "available only in secure contexts (HTTPS)" and "in Dedicated Web Workers" (https://developer.mozilla.org/en-US/docs/Web/API/VideoEncoder). Its compatibility data (mdn/browser-compat-data,
api/VideoEncoder.jsonandapi/AudioEncoder.json, read the same day) gives:Chrome / Edge Firefox Safari (macOS and iOS) Firefox for Android VideoEncoder,VideoFrame94 130 16.4 no VideoEncoderAudioEncoder,AudioData94 130 26 no caniuse, "WebCodecs API" (https://caniuse.com/webcodecs, its data last changed 2026-09-30, read 2026-10-12): supported in Chrome and Edge from 94, Firefox from 130, Safari and iOS Safari from 26; Safari 16.4 to 18.7 "Video-only support"; Firefox for Android not; 91.02% of users fully and 3.45% partly.
Which codecs a browser will encode varies by machine. Across 7,655,853 sessions of one site (https://webcodecsfundamentals.org/datasets/codec-support-table/, read 2026-10-12, no date given),
avc1.42001f(H.264 Baseline, up to 720p) encoded in 99.64% of them,avc1.640028(High, 1080p) in 98.44%, AAC (mp4a.40.2) in 91.93% and Opus in 97.24%.VideoEncoder.isConfigSupported()says it for the machine at hand.
So a browser on a desktop or laptop can encode the picture today; the sound needs Safari 26 or another browser, and the service can mix and encode the sound itself (the mix took 3 to 5 s of the measured renders, the AAC less) and put it with the browser's picture, which also covers a browser that cannot.
5.3 What a frame costs on an ordinary laptop GPU
What was measured here, and what is cited:
- Compatibility draws a frame for less work than Forward+. The cold open's first 240 frames
as a preview with Godot's Compatibility renderer (
opengl3,gl_compatibility, the web export's), on Mesa's llvmpipe, pinned to the same core as p240b (rate4/c240, alone-timed as in "Measured"): 2.18 CPU-seconds a frame against Forward+'s 3.48 on lavapipe, 0.63 of the work; 320 s alone for the whole render against 484 s. - A desktop GPU, measured (M15): Forward+ on the RX 6700 XT drew the cold open's 674 frames
in 55.9 s in one Godot job, 83 ms a frame with the frame's capture, and in 20.5 s in six
jobs at once, 30 ms a frame of the GPU's time (
m15-runners.md, "Measured"). - An ordinary laptop GPU, cited: an Intel Iris Xe (Tiger Lake) is "2.1 FP32 teraFLOPs" (https://en.wikipedia.org/wiki/Intel_Xe), Apple's M1 "2.6 TFLOPs" with "68.25 GB/s" of memory bandwidth (https://en.wikipedia.org/wiki/Apple_M1); the RX 6700 XT 13,215 GFLOPS boost and 384 GB/s (https://en.wikipedia.org/wiki/Radeon_RX_6000_series), all read 2026-10-12. A laptop's integrated GPU has about a fifth to a sixth of the RX 6700 XT's arithmetic and bandwidth.
So, worked out rather than measured on a laptop: the RX 6700 XT's 30 ms a frame of GPU time, times 5 to 6 for a laptop's integrated GPU, times 0.63 for Compatibility, is about 0.1 to 0.2 s a 1280x720 frame; reading each frame back from WebGL and handing it to the encoder adds a few milliseconds, and the page's one thread its scene work. Taking the single job's 83 ms as the GPU's time instead gives 0.3 s. The cold open's 674 frames: about 1 to 4 minutes on an ordinary laptop, against 17.5 minutes on four of this box's CPUs (1052 s, measured), 21 on the service's two (the prior) and 7 with a render worker for seven cents. Until it is measured on a real laptop in a browser this is an estimate within a factor of two either way; the next branch measures it first (5.4).
5.4 For or against a browser runner
For it, for previews, as the next branch; not for final renders.
- Speed: about 1 to 4 minutes for the cold open's preview on an ordinary laptop's GPU (worked out, 5.3), against 21 on the service's two CPUs and 7 with a paid render worker, and the person waits behind nobody. The service's CPUs are left for people without a GPU (a WebGL renderer named SwiftShader or llvmpipe says so) and for final renders.
- Picture: what the browser draws is what web Studio's player already shows the person, and within a few levels of the render (5.1). Making the service's previews Compatibility too makes a preview the same wherever it is drawn, for less CPU.
- Encoding:
VideoEncoderin every desktop browser in use (Chrome and Edge 94, Firefox 130, Safari 16.4); the sound mixed on the service (seconds) and put with the picture there, so Safari before 26 and a browser without AAC still work (5.2). - Final renders stay where they are (Forward+ on the service, a runner or render workers): the master is the show's own look, frame for frame, and an hour-long render in a browser tab is fragile.
What the next branch must find out or settle first, in order:
- Measure it on real laptops before building on the estimate: the cold open's frames drawn in the browser on an integrated GPU (Intel, AMD, Apple), the time a frame, the time to read it back and to encode it.
- A tab must stay in front. A page's frames stop when its tab is hidden (the engine draws on the page's animation frames); the browser runner draws while Studio is open and visible, says so, and goes on where it stopped.
- Frame-exact and memory-safe: the player drawn at the render's size, frame by frame on its own clock, not the timeline's, and a lost WebGL context taken up again from the last frame kept.
- Even out the lighting (5.1), with the comparison above as its check.
Proof
core/test/render-estimate.test.ts: the rates are the measured work of a frame; every alone-timed render within 30% of its time alone, and every render on shared CPUs slower than the estimate (the table above); growth with frames, size and CPUs, and chunks at once; a GPU's and a runner's own speed; the service's own renders (the prior and its wide range at first, its own seconds a frame with the newest weighing most, its own spread once it has five, bounds, kept as JSON); the words, a range's too.core/test/render-line.test.ts: another account's preview draws after a long final's current batch, then all its turns, then the final goes on; accounts take turns, within an account the first to join first; previews pass finals of anyone; each waiting render's place and time, the drawing one's own time left bounding it; a newcomer's place with nothing ahead and behind its show's own queue; one stopped while it waits leaves; a daemon gone gives the turn on; no turn for a render not in the line.core/test/host-render-line.test.ts(real daemons, the stand-in engine, real ffmpeg): Ada's full render draws its first batch; Bo's preview waits for it (queued,ahead: 1,estimateSec), another of his would be after 2; as her batch ends his preview draws and finishes first, while hers waits between its batches (queuedagain,timings.waitMs), and is drawn in more than one batch; hisrender.jsonsays his wait apart, and his render minutes leave it out; the service keeps what his preview took, and the next estimate comes from it (sooner, the stand-in being faster than the prior); the estimate before any render ("starting now", the prior's range around it), a paired GPU runner's time beside it and faster, and a show the person is not in refused.core/test/render-workers.test.ts(an in-memory Machines API, a clock moved by the test): off as the service comes; the split (5 chunks for oneperformance-8x, at most what is allowed, none for a short render or one made from every frame); the Machine made (the service's image,performance8 CPUs, 16 GB,reelwright worker --service …, a token in its environment); stopped after the idle minutes and its minutes counted; the stopped one reused; all stopped when turned off; one of an old image destroyed and a new one made. Fly's prices, andfly.toml's size.core/test/host-render-workers.test.ts(real daemons, a stand-in of the Machines API whose Machines runrunWorkerin the test): off, no Machine is ever asked for; allowed one, a Machine is made and started for a render, four of its five chunks are drawn there and come back encoded, and turned off it stops, its minutes counted; a worker lost mid-chunk (its Machine gone with no stop asked for, while it draws) has its parts drawn by the other worker, the render whole, the lost one having finished none; a worker reaches only its own part's files (another worker's part, a path out of it, no token or another token: refused) and lands only its result and segment, each byte as it said.core/test/host-signups.test.ts,host-console.test.ts,host-settings.test.ts: the day's minutes refused at the boundary with their words; the console's costs (a minute $0.0015, the limits' cost, Fly's page and the date), its Render workers section (0, what each size costs, why CPUs, no token), a size Fly does not price refused.engine/tests/ui/rw_render_where_test.gd: the dialog's words, here and on a computer, offline, pairing, Cancel, runners off; a wait and a range as a person reads them; the same in Spanish; the chosen place drawn as chosen; and the waiting words of a render in the line.tools/web/render-where-check.ts: the web export against a real service pinned to two CPUs on lavapipe and Bo's real runner: Bo's dialog on a phone ("after 1 ahead of you", "on Bo's box") and his render going there; Ada's on a desktop offering Add a computer, which opens Your computers' pairing; each at both widths.tools/host/rate-check.tsagainst this box's own service (four CPUs, a test account, a copy of the demo): the cold open's preview asked for, timed from asking to done, the estimate before it and after it ("Measured", "The prior's range").tools/host/render-rate.ts's alone clock checked on busy loops (one keeps 0.51 of two CPUs busy, two 0.99, three 0.99).tools/web/player-frames-check.tsandplayer-frames-compare.py: the comparison in 5.1.- Mutation-checked, each guarantee's code taken out and its test run: one render at a time, previews before finals, accounts in turn, a place counting only the drawing render's current turn, a turn a batch, waiting not billed, the place told, the estimate from the service's own renders, the newest weighing most, the prior's range until five, the estimate within 30%, the estimate for one's own show only, a lost worker's part drawn elsewhere, workers off by default, a worker's own parts only, a worker's bytes checked, minutes a day.
Not yet
- The estimate does not know an episode's own shots: frames 240 to 480 of the cold open cost 35% more at full size than its first 240. The service's own renders teach it the level, not the episode.
- The prior was measured on the dev box and checked once on Fly (above, 3.4% under for a new show's preview); the service's own renders time it after that.
- Batches start Godot again, about 9 s each on Fly (14% of the drawing), and the prior counts
them. Keeping one engine across an episode's batches (
service-render-warm) would take them out: the prior then falls by that much, measured again on Fly as above. - A browser runner (5.4) is the next branch, not this one.
- The line is one turn at a time on the service. With render workers the service's own chunk is one turn, so a farmed render holds the CPUs longer per turn than a batch.
- A final render waits for as long as previews keep coming.
- A render spread over workers is not drawn in batches, so a stopped one starts again from zero rather than from the frames it kept.
- The workers' address for the service is its public one (
WS_ORIGIN); Fly's private network would spare the proxy.